Comments
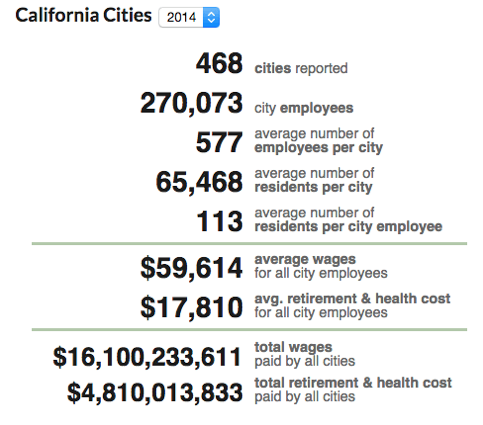
CAL WATCHDOG-Public employees at California cities and counties took home more than $36 billion in compensation last year, according to new payroll data released by the state’s chief fiscal officer.State Controller Betty T. Yee disclosed the 2014 payroll data from 54 counties and 468 cities, which included information on more than 600,000 employees. The disclosure is part of the controller’s latest update to the “Government Compensation in California” website.
The open government online portal allows users to map compensation levels throughout the state, assemble charts, evaluate payroll trends and export data for in-depth statistical analysis.
Vernon: Smallest City, Biggest Pay
The state controller’s public employee payroll website has become a powerful tool for journalists and citizen watchdogs to identify wasteful spending and corruption in local government.
Among the municipalities with questionable payroll data from 2014: the city of Vernon. Although it is the least populous city in California, with just 123 residents, Vernon has double number of employees. And those employees earn $103,601 per year in salary — the highest average salary in the state. Vernon employees also take home, on average, another $32,462 per year in health and retirement benefits.
Vernon’s top salary is followed by the city of Hayward with $94,041 average salary, and Palm Desert at $89,582 in average salary. The state controller’s office notes that the average wages for city governments overall fell by 3 percent to $59,614.
In 2014, the average salary for county employees increased by approximately 3 percent to $60,993. At the county level, the nearly 19,000 employees at Santa Clara County received the highest average wage, earning $78,486 per year in wages and $27,655 in retirement and health benefits.
Nine Local Governments Fail to Disclose Data
The controller’s office classified six cities as non-compliant entities for having “filed a compensation report that was incomplete, was in a format different than the one requested by the Controller’s Office, or was submitted after the reporting deadline.” San Francisco, the largest non-compliant entity joined the cities of Bell, Compton, Covina, Dana Point and Santa Ana on the list of non-compliant entities.
The counties of Modoc, Monterey and Riverside were the three counties, or 5.3 percent, that failed to file.
The city and county of Los Angeles remain the largest local government agencies. Los Angeles County employs 103,338 people with a cumulative wage of $7.2 billion in annual salary and $2.76 billion in health and retirement benefits. The city of Los Angeles paid out $4.5 billion in wages and $703 million in health and retirement benefits.
Yee’s latest disclosure builds on the work of her predecessor. In 2010, following the high-profile corruption case at the city of Bell, then-Controller John Chiang didn’t wait around for local governments to clean up their act. He ordered cities, counties and special districts, under Government Code sections 12463 and 53892, to share salary and other wage information with his office. Initially, some local governments balked, then dragged their feet in disclosing the payroll data.
To access State Controller Betty Yee’s payroll database, go to publicpay.ca.gov.
Top 10 Highest County Employees in California
1. Faculty Physician-Contract: $1,360,744
Kern County2. Faculty Physician-Contract: $1,295,929
Kern County3. Orthopedic Surgeon-Contract: $1,092,651
Kern County4. Chairman, Department of Surgery: $851,665
Kern County5. Medical Director II: $775,999
Los Angeles County6. Physician – VMC: $760,461
Santa Clara County7. Chief Physician III Surgery-Neurological: $728,489
Los Angeles County8. Physician: $727,864
San Joaquin County9. Physician – VMC: $684,365
Santa Clara County10. Physician – VMC: $658,745
Santa Clara CountyTop 10 Highest City Employees in California
1. Police Sergeant: $592,652
City of Burbank2. Fire Chief: $487,871
City of Richmond3. Chief of Police: $487,644
City of El Monte4. City Manager: $470,249
City of Lincoln5. City Manager: $419,840
City of West Covina6. City Attorney: $412,211
City of Escondido7. Power Engineering Manager: $403,271
City of Los Angeles8. Assistant City Manager: $396,548
City of Oxnard9. City Manager: $395,501
City of Escondido10. Police Officer (PERS): $393,573
City of Oakland(John Hrabe is an investigative journalist, freelance writer and communications strategist with a decade of experience managing media outreach for local, state and federal political campaigns, public relations clients, and new media start-ups. This piece was posted first at CalWatchDog.com) Edited for CityWatch by Linda Abrams.
-cw
CityWatch
Vol 13 Issue 104
Pub: Dec 25, 2015
LA City, County Own Fattest Payrolls … Here’s Salary Data

Typography
- Smaller Small Medium Big Bigger
- Default Helvetica Segoe Georgia Times
- Reading Mode